When optimizing your website, there is one thing that matters above all—loading speed. The faster a website loads, the better it is for your end customers.
From a purely human perspective, people are not inclined to wait but to get on with other activities. The same thing happens when they visit a slow website—in most cases, they simply close it. That's why you need to optimize the speed of your website. However, that's not the only reason why speed is important.
Search engines such as Google "like" faster sites. The faster your website is, the better it is for your search engine results. This is good for you because it brings more visitors. More visitors mean more sales, no matter what industry you are in.
How to Check Website Loading Time
Let's take a look at how you can objectively check website speed, what criteria to use, and what factors are important. Every website has its specifics and must be considered individually.
Start by testing your site for page load speed and performance. You can use these tests to identify the problems or areas for improvement in your WordPress websites. With such tests, you can determine whether the problem is with your theme, content, TTFB (Time to First Byte), a plugin, or something else.
The problem can be complex and affect multiple areas, not just one. Objective testing means that you run a series of tests from different sources, including external ones.
A good approach is to write down the initial results and after each step, run new tests and then write down the results again. This way you can visually see if the changes you've made are producing results and if so, how much improvement there is.
WordPress Performance Optimization Tips To Speed Up Your Site
Before we start testing, it's important to clarify the following: For these tests, we are using the WordPress 4.9.4 version installed on our WordPress hosting package "Blogger Start".
In this installation, we have placed posts, tags, categories, etc. with dummy content. All themes and plugins are used as examples only. This in no way means that they are problematic and you should not use them.
We aim to show the different cases where certain components could be problematic, and the specific themes and plugins are used only as examples.
Running Site Speed Optimization Tests
Let us start with the actual tests. For this, we will use both external and local sources for the tests. We will use some of the most popular website speed optimization tools for external diagnostics, such as WebPageTest.org, Google PageSpeed Insights, GTmetrix, and our own browser's debug console.
1. Browser Debug Console Test
The browser debug console is an integral part of most modern browsers—Google Chrome, Mozilla Firefox, or Safari. The first real example we will give is the debug console of our browser (we used Google Chrome for the example):
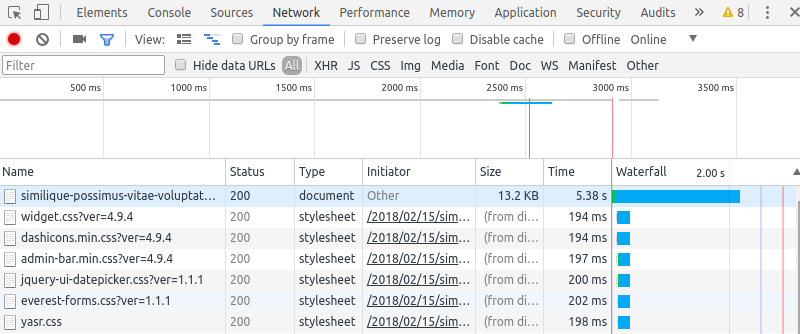
In this example, we have opened the Network tab and then loaded a random article. In the "Time" column, you can immediately see that something is wrong with the loading of this page. The loading time is a whole 5.38 seconds! This is quite a long time and a clear indication of a problem.
2. GTmetrix Performace Test
We will therefore continue our tests with other sources. Why is this necessary? Another good practice is to check a certain aspect using multiple sources because one source is not always reliable enough. If you check from other sources, you can make a clear comparison and see if there are any real difficulties. We will do another check with the free tool from GTmetrix:
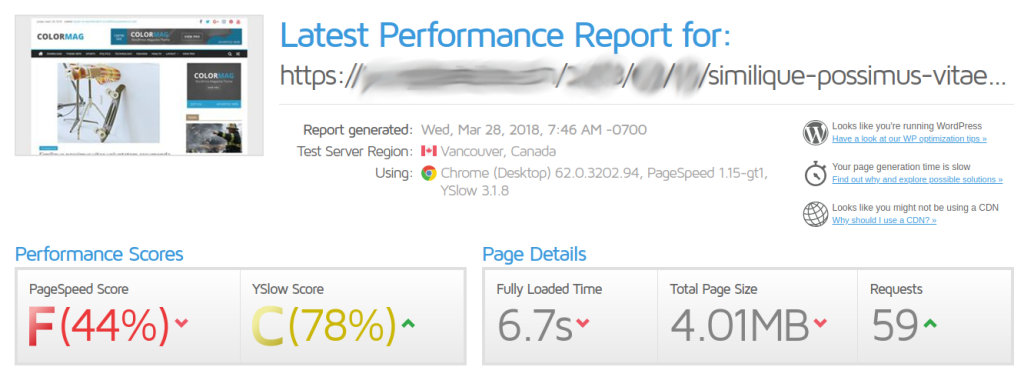
The following problems can also be found in this test: The load time from Vancouver, Canada, is 6.7 seconds and our page size is 4.01 MB. The load time is again extremely high. In addition, the page size of 4 MB is large and in need of optimization. These are two complex factors that can be tracked and improved.
3. WebPageTest.org Speed Test
Let's run another test with the free tool from WebPageTest.org:
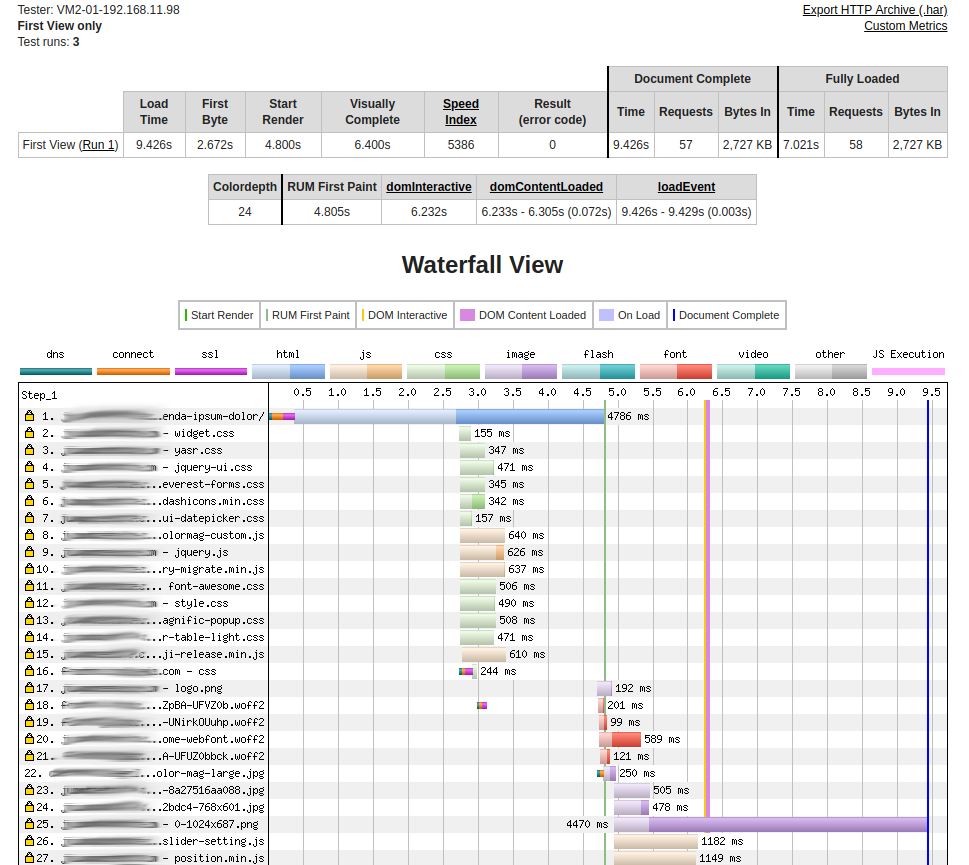
The initial loading time here is 4786 milliseconds (4.7 seconds). Another large resource is also noted, a PNG image, which loads in 4470 milliseconds (4.4 seconds). This further slows down the website.
4. Google PageSpeed Insights
Let us run one last test using the Google PageSpeed Insights tool:
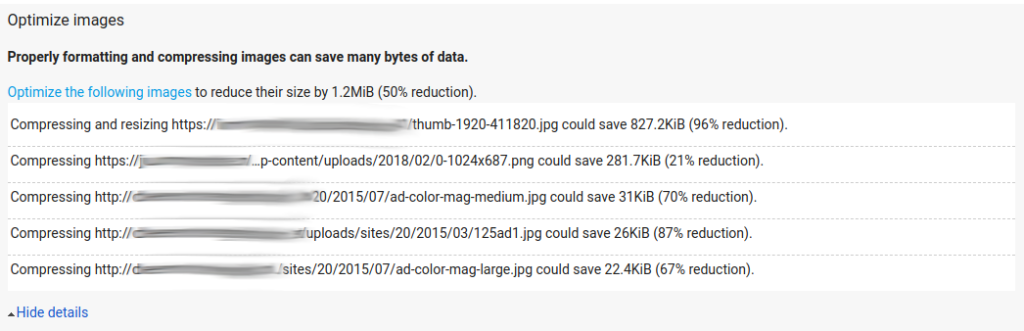
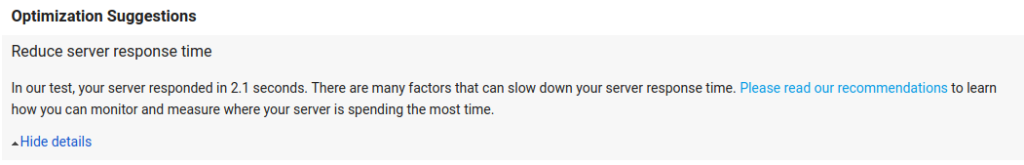
It can also be seen here that the loading time is 2.1 seconds. Again, there is a tendency towards large images—we have one image with the .JPG extension that is 827 kb in size and another .PNG image that is 281 kb in size.
Large Image Optimization to Improve WordPress Site Load Speed
So far, we have conducted 4 independent tests, the cumulative results of which seem to point to 2 main problems—a very slow initial loading speed and problematic large images. Large images are problematic for one main reason—the larger the image, the longer it takes to download.
Slow downloads are particularly noticeable on mobile devices as users do not always have access to fast internet access. According to statistics from many sources, mobile consumption is on the rise and this trend is set to continue in the future.
Large-format images are a relatively easy problem to solve. You can compress them before uploading them to your WordPress Media Library or remove them altogether, depending on how you decide to solve this case. For our testing purposes, we have simply removed them to show you what a difference this can make:
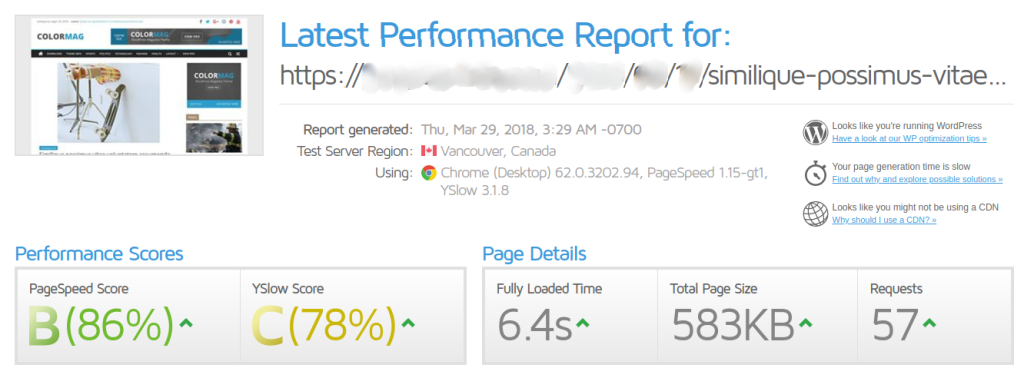
You can now see a significant improvement from 4MB to 583KB. That's ~149% smaller than the original size. You can judge for yourself how such a simple improvement can make this relatively slight change. Large images are especially problematic on the front page of a website. Since this page is the main page and the entry point to the other subpages, it is the most frequently visited.
Update WordPress to the Latest Version
We advise our customers to regularly update their WordPress installations. This includes the WordPress core, installed plugins (whether activated or not), and installed themes. This is necessary because each new version of WordPress brings new improvements, which, in most cases, can only bring benefits.
Updating is not just about improving speed but also about improving the security of your website. Security vulnerabilities are often found in WordPress, its themes, and plugins. This is normal for absolutely every website. It is therefore highly recommended to update the version of your website regularly.
Use Pagination in Comments for Better Page Load Time
The more legitimate comments you have on your website, the better. It means that you have a solid audience and that your website is of interest to others. On the one hand, this is very good, but a high number of comments can hurt the speed of your website.
Speed is mainly affected by the number of comments per page. The more comments are displayed at once, the more negative the effect on speed. The comment system integrated in WordPress supports a pagination function or the splitting of comments into individual pages according to the number you specify. You can access this option in your WordPress administration area - >
Settings - > Comments:

In the example above, we have split our comments so that only 10 of them are displayed on each page. If you use a comment plugin (a popular plugin on many WordPress systems is Disquss, for example), you should also consider introducing such an option.
Keep Your WordPress Themes and Plugins in Check
For many of you, it may seem obvious that you should always select the plugins and themes you want to use. Nevertheless, it is important to mention this point because it is of particular importance. You should pay attention to which plugins you install and how many you install.
You need to know that the more plugins you install, the more difficult the website will be to use. Do not install plugins if they are not necessary. If you can achieve something without a plugin, then that is the best option. The type of plugin, i.e., what it is used for, is also important.
For example, we can use a plugin that adds a Google Analytics code to your website and a plugin that shows other related articles in each article (Related Posts plugin). Although the two plugins in this example do two completely different things, you can imagine what they do at a lower level.
The plugin for adding Google Analytics tracking code simply adds a few lines of code to your website in a specific place. The other plugin for displaying similar articles within each article needs to query the database, crawl all the articles already created, compare them, and present the results to the user based on this crawl and comparison.
As you can see, this is quite a complex process. You can also estimate whether an article with such a plugin is visited by many people at the same time. The result is a delay in the loading speed of the website, errors because the allocated resources are exhausted, and a sharp increase in CPU minutes allocated to a particular hosting account.
The same can happen with non-optimized themes. Many themes look great at first glance—beautiful design and many features in the administration console. However, the principle is the same as with plugins—the more functions there are, the slower WordPress works. Each function means additional JavaScript, additional CSS, or an additional PHP function that is called.
All of this can be monitored with the tools we have already introduced, be it the in-browser debug console, WebPageTest, GTPmetrix, or Google PageSpeed Insights. From there, you can always check the speed, page size, and number of requests. All of these metrics are important to determine how fast your website is.
Want to use an optimized WP theme? Here’s our article about the best free SEO-friendly WordPress themes.
Use Extracts in Title Pages for Higher Page Speeds
Again, this is a simple point that is often overlooked as a way to speed up pages. In this case, it is about limiting the length of text on header pages (e.g., the homepage). The idea is that a short table of contents or user introduction should be presented at these points. If someone wants to, they can read the whole article at any time by opening it separately.
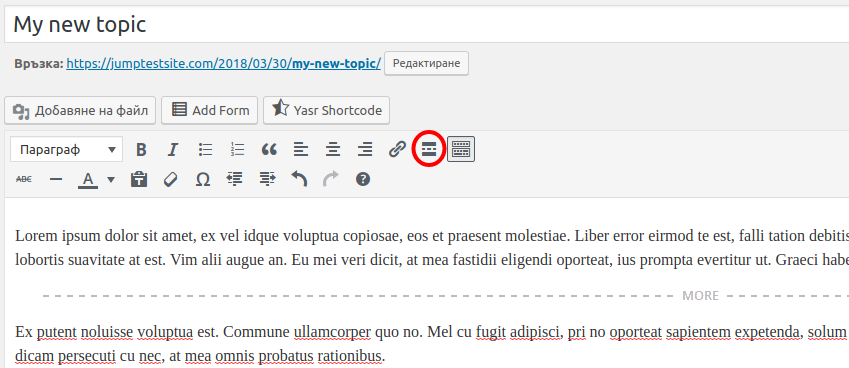
The scope is limited by inserting a "more" tag in each article. This dividing line is placed above the excerpt that is to be displayed on the WordPress homepage. The rest of the text becomes visible once the entire article has been opened. This makes it easier to load your homepages as they have to load less content at once:
Use Comment Filtering to Speed Up WordPress
Filtering your comments is a very important step. By filtering we mean controlling the comments and automatically preventing SPAM comments. If you do not protect the comments on your pages in any way, it is almost certain that sooner or later, you will experience an unpleasant surprise on your website.
It is quite possible that you will receive hundreds or even thousands of SPAM comments on a single page that have been created by automated (bot) programs. These comments are mostly used for the benefit of others by inserting someone else's URL on your page. The large number of comments slows down your website and significantly increases resource consumption.
The easiest way to protect yourself from such comments is to use the Akismet plugin. This plugin is supplied as standard with every new WordPress installation but is not activated. To activate it, you need to register on the Akismet website, obtain a unique key, and enter it when activating the plugin.
Troubleshooting Problems With Plugins and Themes in WordPress Websites
We have already fixed a possible problem with large images, but according to our tests, the website still loads quite slowly (6.4 seconds). In most cases, this is a problem related to a non-optimized theme or plugin. Based on the tests above, you can see that the slow loading is caused by slow PHP or MySQL query processing.
This is particularly clear in our WebPageTest where the type of queries are visible. The first query first performs a DNS call, then a TCP connection, then a "read and validate" of the SSL certificate we have installed in our test environment, and finally the problem area becomes visible for the output of the HTML data.
All websites operated with WordPress use the PHP programming language. PHP is responsible for the entire generation of valid HTML code that is output to the visitors of the website. In the test shown by WebPageTest, you can see that HTML generation takes between ~0.4 and 4.7 seconds.
However, the conventional way of recognizing such a problem is not easy for people who are not technically familiar with how WordPress works. This involves tracing all plugins and themes at the code level until the cause of the slow loading is finally found.
As you can understand, this often results in the need to hire a WordPress developer, and not everyone can do this.
Using WP Profiler to Find Site Performance Issues
We have developed our tool for WordPress site diagnostics. So far, it is enabled for most of our customers who use WordPress hosting at Jump.
If you are already a customer but do not have this tool, you can always contact us at support@hostingjump.com, make an inquiry in our customer area, or give us a call. We will be happy to provide you with more information. You can find this tool in your cPanel user account - > WP Profiler:

This tool allows end users to diagnose their WordPress installations themselves.
IMPORTANT: To use this tool, you must have the PHP extension PHAR activated. This module can be activated via your cPanel - >
Select the PHP version - > Switch to PHP modules.
The WP Profiler tool works as follows:
- Initially, all WordPress installations in the current hosting account are recognized.
- A real-time diagnosis can be performed for each account, which includes the following criteria:
- The total time, measured in seconds, that each function takes to execute
- The time taken to execute queries to the MySQL database
- The number of queries to the MySQL database
- The ratio of cached to non-cached queries
- The number of successfully cached queries
- The number of unsuccessfully cached queries
- What is analyzed are the internal functions of the specific WordPress website. These can be functions that originate from the core of WordPress itself but also functions that originate from themes and plugins. Here, you need to know a little about your website.
- We recommend that you take a look at your active theme and plugins before carrying out this test.
- The table below shows the total values for all.
Let's check our problematic website:
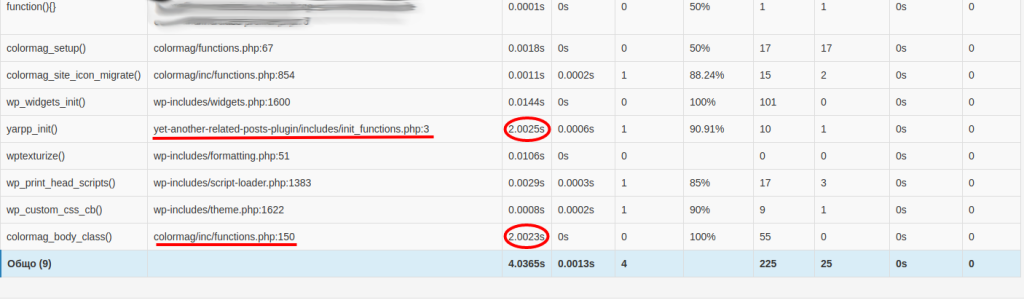
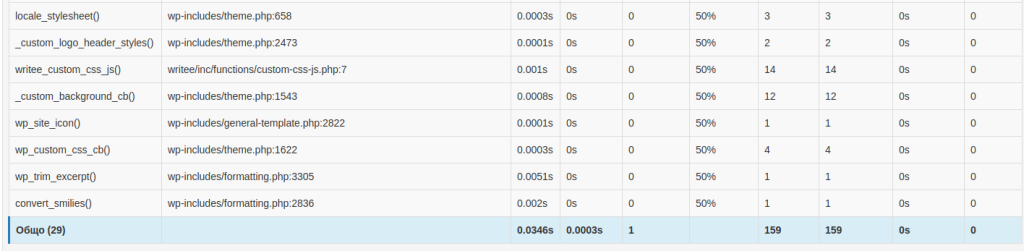
After this test, we were able to identify 2 problematic elements—the theme we used and the Yet Another Related Posts plugin. We emphasize once again that these tests in no way imply that the theme and plugin we use have such problems. This is a simulation of real problems that can occur even with the best WordPress plugins and themes.
Processing the PHP requests here takes ~2 seconds for the theme and another 2 seconds for our plugin. In this case, you have 2 options—either you investigate what the problem is at the code level of the theme and plugin, or you simply deactivate and replace them. We will deactivate the problematic plugin and change the theme. Then, we will repeat the test with the tool in cPanel:
The result is quite impressive. We managed to reduce the execution time of PHP requests from 4.03 seconds to 0.03 seconds (30 milliseconds). As we mentioned earlier, it is a good practice not to run tests from a single location.
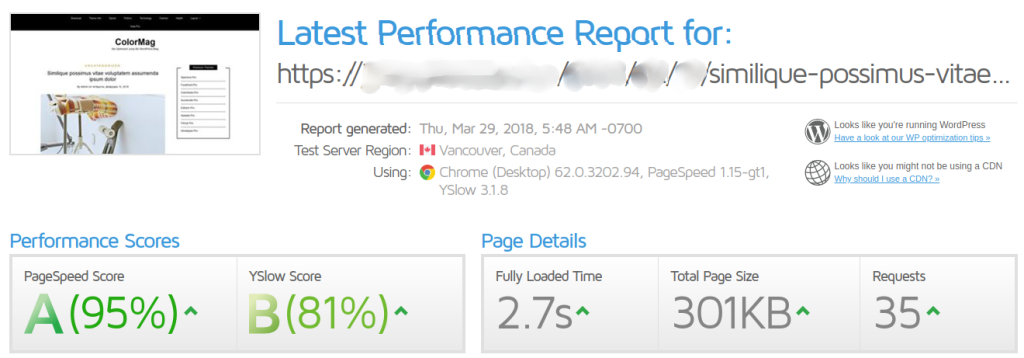
Let's run a test again with the external and independent tool from GTmetrix:
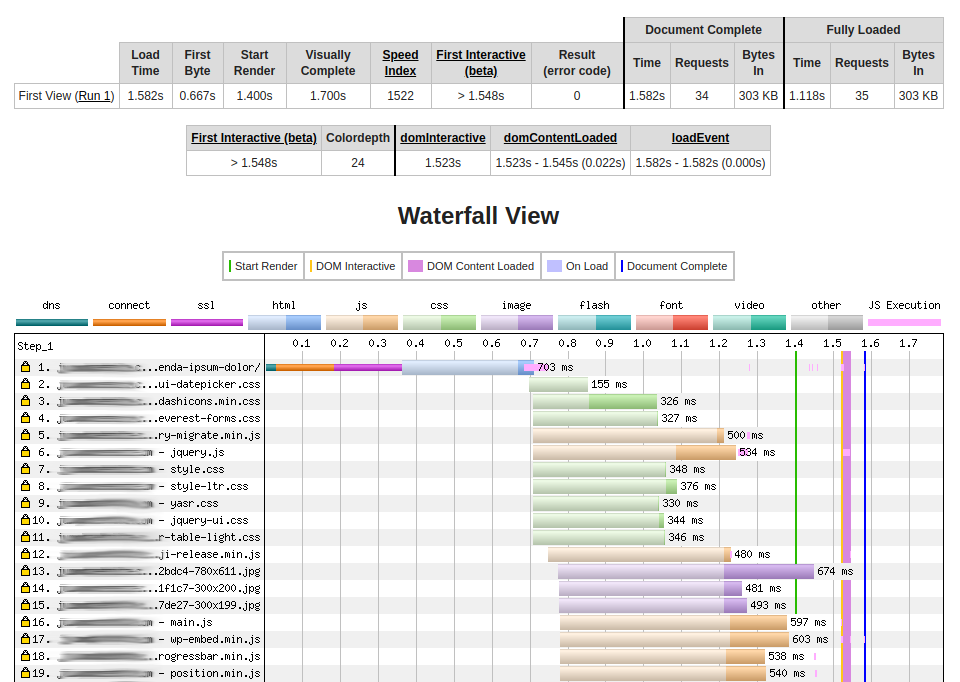
We will also do a WebPageTest:
And one last test with Google PageSpeed Insights:
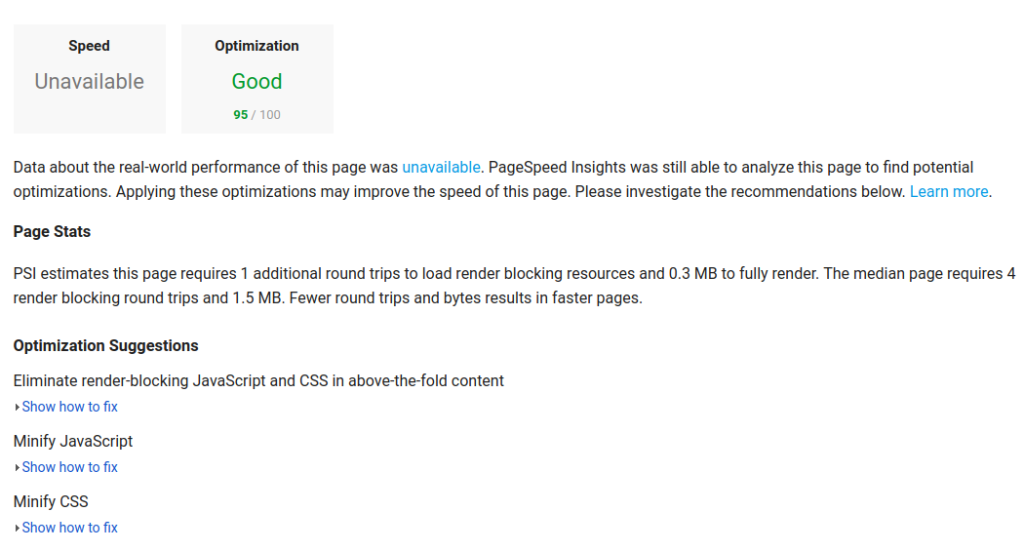
It can be concluded from all these tests that our efforts have borne fruit. The GTmetrix results show that we have succeeded in reducing the boot time from 6.4 seconds to 2.7 seconds. In WebPageTest, the HTML rendering time was reduced from 4786 milliseconds (4.7 seconds) to 703 milliseconds (0.7 seconds). Our test in Google PageSpeed Insights no longer shows any warnings about the decrease in server response time.
Working With WP-CLI to Recognize Problems With WordPress Plugins and Themes
For technology enthusiasts who like to work via a terminal, we have also integrated the WP-CLI tool into every WordPress hosting package. This is a tool that allows you to display various settings and results directly in the terminal without having to use an external graphical user interface (such as cPanel).
We will show you some practical examples with which you can perform the above checks without having to log into cPanel. Start by logging into the root directory of your WordPress installation. This is important because the WP-CLI tool works on such a principle—it outputs results for the specific installation whose path you are currently in.
The path to WP-CLI is /usr/local/bin/wp, but you can also call it directly with the keyword wp. Firstly, make sure that you are in the correct directory and have a valid WordPress installation. Check the URL of your website:
wp option get siteurland an additional check for your WordPress version:
wp core versionYou have now made sure that you are in the correct directory and are exploring the correct installation. You can start exploring it and checking for possible problems. Before we start, we should mention a few important things - the result columns we will output that we are interested in are:
- time: The time for which a function is loaded. This is your most important metric to determine which function on your website is slow.
- cache_hits: You are interested in the percentage of caches being high. A value above 70-80% is a good indicator.
- cache_misses: The number of misses must be lower than the number of hits.
- query_time: Time for the execution of database queries. Must also be a low value.
Let us continue our exploration by executing the following command:
wp profile stageThis command gives you a fairly detailed table with the loading times of the most important functions of the WordPress core.
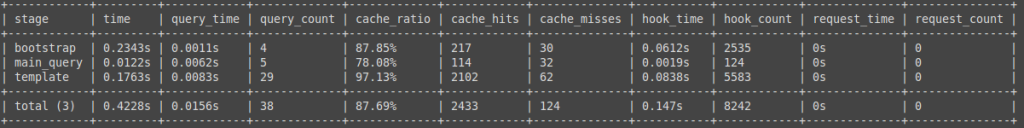
In the first column of this table, we can see the loading levels. You can also output the results of the bootstrap level (stage) using the command:
wp profile stage bootstrap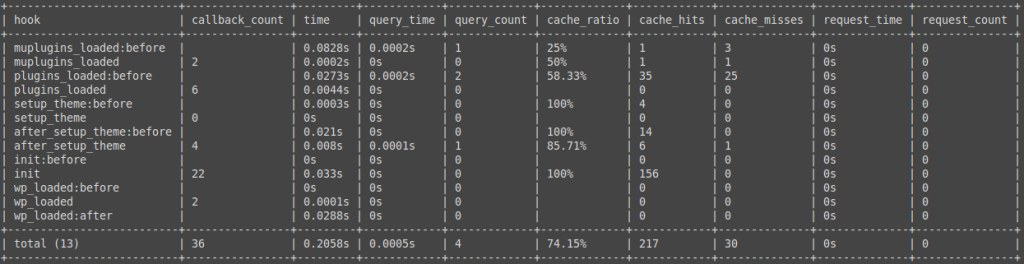
Bootstrap is the process by which the software, in this case WordPress, boots up and makes preparations to load all the necessary functions. As you can see from our example, the total execution time is 0.2 seconds, which is perfectly normal and does not cause any problems.
In the next example, we will output all levels, but we will use the --spotlight flag. This flag will filter out null results and provide better visibility
wp profile stage --all --spotlightIn the next example, we will look at the wp hook. This hook combines all the functions that are called by your theme and your plugins. Therefore, we will focus on this. Use the following command:
wp profile hook wp --all --spotlight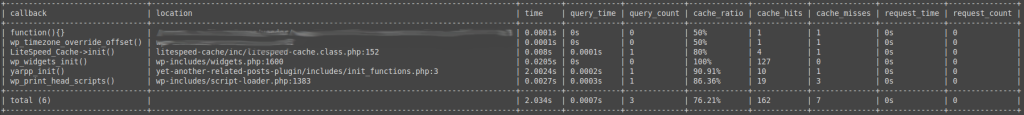
In this example, we have again activated the "problematic" Yet Another Related Posts plugin. The command shows similar results as we have shown you with our tool in the cPanel. You can see pretty quickly that this plugin's load time of 2.0024 seconds is not normal and action needs to be taken.
These results are visible in the Callback and Location column. We will deactivate the plugin with the following command and retest with the wp profile hook wp --all --spotlight:
wp plugin deactivate yet-another-related-posts-plugin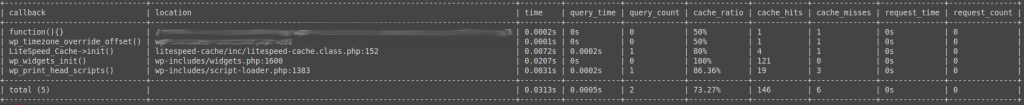
We can see that our intervention has made a difference. The loading time for all functions called by themes and plugins is now 0.03 seconds! If you decide to fix the problem, you can always perform another simple check of the problematic function by looking at exactly where it is present. We use the grep command for this:
grep -liR 'yarpp_init' wp-content/plugins/*In this way, you can immediately see whether the problematic function is only called in one place and where exactly it is located. If you have more than one repeating result, you can sort everything that repeats with the following command:
grep -liR 'yarpp_init' wp-content/plugins/* | cut -d '/' -f3 | sort -uYou should also focus on the following points: In the example, we have activated the WordPress caching plugin LiteSpeed Cache, but still, the execution time of all requests is very high due to a "problematic" plugin.
This is because some queries simply cannot be cached. This is why we decided to write this article— you need to know exactly what can be cached and what measures you need to take to have a very fast and optimized website.
Another important parameter of WP-CLI is the ability to diagnose a specific page. You can use this function if, for example, you have a slow page with a separate contact form and you want to see whether the problem is limited to this web page or whether it is general. The parameter is --url= and the exact command is as follows (our URL https://yourwebsite.com/contacts is an example):
wp profile hook wp --all --spotlight url=https://yourwebsite.com/contactsWith the next command a comparison is made with the main page:
wp profile hook wp --all --spotlight --url=https://yourwebsite.comLearn how to use WP-CLI to update plugins by reading our comprehensive guide.
Limiting the Number of Post Revisions to Boost Your WordPress Performance
If you create articles in your WordPress and edit them frequently, additional internal copies are added by default with every change. These copies are used to check old changes in case you need them. These copies are called revisions and their number is unlimited by default.
The large number of revisions can be problematic if, for example, you are using a WordPress plugin that unnecessarily searches the post revisions as well. As you can see, the search becomes more difficult because additional data records are queried in your WordPress database. You can limit the number of post revisions by adding the following line to your main configuration file wp-config.php:
define( 'WP_POST_REVISIONS', 5 );Add this line before the line /* That's all, finish editing! Have fun blogging. */. This will limit the maximum number of revisions to 5 in total.
Remove WordPress pseudo-cron to Improve Site Performance
The WordPress pseudo-cron is an integrated PHP function that is called every time someone visits your website. This function was developed to automate various tasks. A whole range of plugins and themes use it.
Calling it every time someone visits your website is not optimal and consumes unnecessary resources. You can disable this feature by re-editing your wp-config.php file and adding the following line before the line
/* That's all, stop editing! Have fun blogging. */:
define('DISABLE_WP_CRON', true);You don't want to disable the automated tasks completely because that could affect some of your site's functionality. We will add our automated task that will run once every 5 minutes. To do this, we go to cPanel - > Automated Tasks and add ours:

Reducing the Number of External Requests to Optimize Your WordPress Site Speed
Many plugins and themes contain resources such as CSS and JavaScript files from external providers. In general, you can use several such resources, but it is not a good idea to have a large number of them. If these resources are loaded from external locations, your website may slow down because you have no way of controlling these locations.
You may even find that some of these locations have temporary issues, which you can see hurts the speed of your website. It is a good practice to consolidate your CSS and JavaScript files into several other files. This will reduce their number.
If possible, you can also embed these external resources directly into your website instead of loading them from an external source. There are no detailed instructions on how to do this, and only minimal programming knowledge is required.
Explore our insightful article on troubleshooting the dreaded "There has been a critical error on this website" message in WordPress.

Speed Up Your WordPress Site With Jump
The hosting we offer is optimized for high speeds. This is achieved through the LiteSpeed web server, LSAPI, and additional internal settings. As a customer, you have access to all these resources not only with our WordPress hosting packages but also with our other shared hosting solutions.
LiteSpeed is a web server that ensures that the websites hosted with us achieve significant loading speeds. It differs from conventional web servers such as Apache in that it provides access to newer and faster technologies such as PHP via LSAPI, Brotli compression (replacing gzip), including QUIC protocol, etc. Here's a detailed comparison between Apache vs LiteSpeed.
In addition, the hosting environment for our WordPress plans is carefully designed to maximize the speed and security of WordPress applications. In addition, a free WP Profiler tool is provided with every WordPress hosting package. This tool, developed by us, helps users understand which components are hindering website performance.